[ Project Usiru is being piloted by IoTForum to use new methods to measure and establish benefits of different experimental interventions to improve Air Quality. This was presented at MINT Digital Innovation Summit 2019 by Arvind Tiwary , Chair IoTForum. You can see the 15-minute talk here. This blog is an extension of that talk ]
Abstract:
Largest crowd sourced data for urban AIQ and experiments in several localities in Bangalore under Bangalore Smart City Ltd (BSCL) to reduce Air pollution and improve health outcomes using private public participation . Beta website at http://bit.ly/UsiruBLR
India unfortunately leads in bad Air Quality
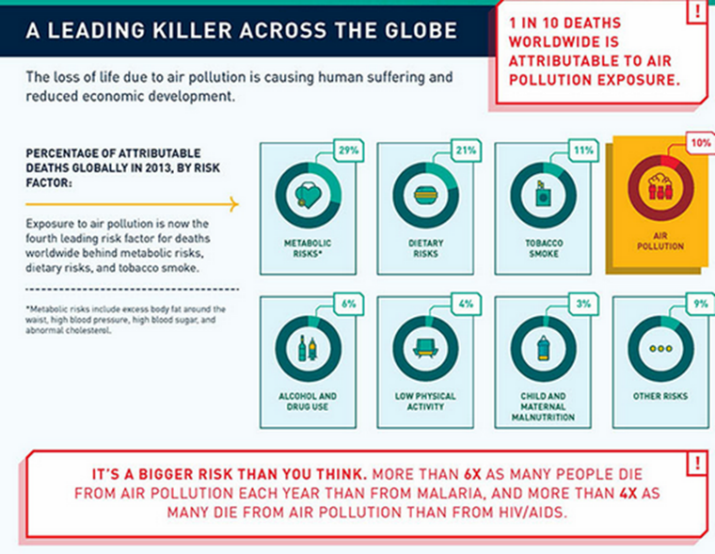
Air quality and pollution have emerged as a global concern and calls for action to manage health and wellness risk have become louder. The WHO has infographics on consequences of Air Quality and sometimes surprising indoor air quality may be worse then outdoor.
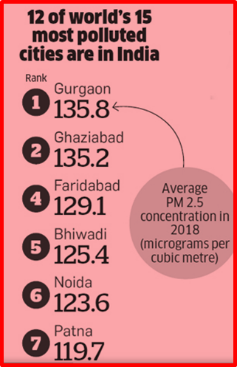
In 2018 India has 12 of the 15 most polluted (PMI2.5) in the world. NCR has been in the news for some time and even our Honourable Supreme court has intervened with restrictions on diesel cars and firecracker usage during Diwali.
Chinese Action
January 2013 was a month of reckoning for the Chinese government. Beijing was enveloped in a thick, apocalyptic smog. The concentration of PM 2.5 touched 755 micrograms per cubic metre (μg/m³) — 30 times higher than the WHO-prescribed daily average limit of 25 g/m³. This forced the government to announce a $277-billion (a tenth of the current Indian economy) plan to cut pollution across the country by the end of 2017. To achieve these targets, new coal-fired plants around Beijing and some other cities were banned and existing ones were asked to cut emissions. Iron and steel plants were asked to limit production and some cities were made to take high-emission vehicles off the roads. The plan had its desired effect. In 2017, PM 2.5 concentration in Beijing was 36% below 2013 under 60 μg/m3
In this blog we describe methods that may be more suitable in Indian context
Air Quality Index (AQI)
There are six AQI categories, namely Good, Satisfactory, Moderately polluted, Poor, Very Poor, and Severe. Each of these categories is decided based on ambient concentration values of air pollutants and their likely health impacts (known as health breakpoints). AQ sub-index and health breakpoints are evolved for eight pollutants (PM10, PM2.5, NO2, SO2, CO, O3, NH3, and Pb) for which short-term (upto 24-hours) National Ambient Air Quality Standards are prescribed.
Based on the measured ambient concentrations of a pollutant, sub-index is calculated, which is a linear function of concentration (e.g. the sub-index for PM2.5 will be 51 at concentration 31 μg/m3, 100 at concentration 60 μg/m3, and 75 at concentration of 45 μg/m3). The worst sub-index determines the overall AQI.
Air quality data can be analysed in two fundamental ways:
- By the frequency and length of time that a certain concentration is exceeded; this requires periodic sampling of the concentration at short time intervals. New mobile devices can sample down to 1 HZ (1 /Second) but 1 per minutes are more commonly reported.
- By concentration averaged over a specified time interval. Modern mobile devices can report minute averages but hourly averages more common in reported statistics. National measures use 2, 8 or 24-hour average. National ambient air quality Guidelines prescribe methods and techniques.
The AQ Index (AQI) is meant to communicate the state of the city and encourage authorities to take action like asking some emitters (Construction) to reduce activity or declare holidays (for schools). All emitters are not equivalent. Diesel cars are worse on NOx but Power Plants (there are 5 within NCR and NTPC Badarpur is a particularly bad emitter) are worst on particulate matter. A report postulates crop burning by farmers in the region as also contributing significantly. The red dots in the image are stubble burning visible on a satellite map.
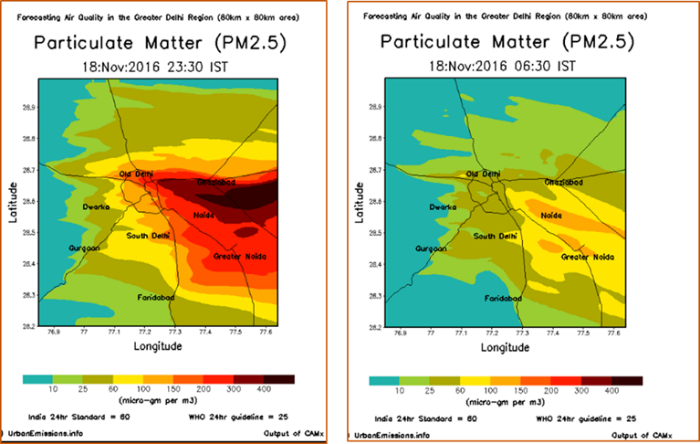
AQ depend on metrological activity and concentration and types of emitters. North India suffers fog during winter due to natural metrological phenomena. There are secular factors like growth in population, construction activity, car population that need to considered in making an assessment of cause and effect and forecast with any degree of certainty. Please pursue the excellent website at http://www.urbanemissions.info/
They have a good visualization of AQ across time .
Building an effective air pollution control plan for the cities and the regions, it is important to know the contribution of sources. This is not an easy process, as it involves many steps, some related to field experiments, some related to laboratory analysis, some related to (guesses, statistical and predictive) modelling, and some related to linking the results to pollution control planning. Pollution source apportionment is complex as illustrated by this simple primer .
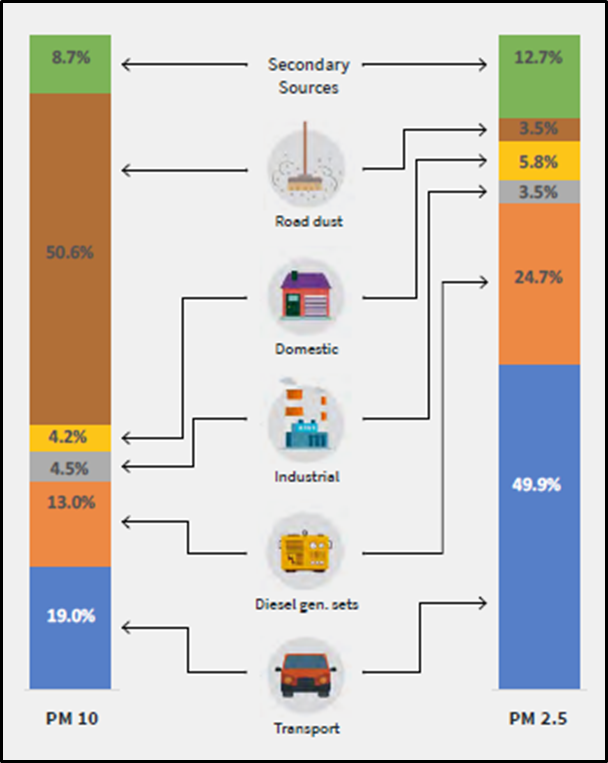
The Clean Air Platform ( supported by Azim Premji Philanthropic Initiative, Biocon Foundation & others) uses this illustrative apportionment model for Bangalore.
The winter sources (% contribution given in parenthesis for PM10 - PM2.5 to the ambient air levels) include: secondary particles (25 - 30%), vehicles (20 - 25%), biomass burning (17 – 26%), MSW burning (9 - 8%) and to a lesser extent soil and road dust….
The summer sources (% contribution given in parenthesis for PM10 - PM2.5 to the ambient air level) include: coal and flyash (37 - 26%), soil and road dust (26 – 27%), secondary particles (10 - 15%), biomass burning (7 - 12%), vehicles (6 – 9%) and MSW burning (8 – 7%).
The contribution of the biomass burning in winter is quite high at 17% (for PM10) 26% (for PM2.5... The enhanced concentration of PM in October-November is possibly due to the effect of post-monsoon crop residue burning (CRB). In all likelihood, the PM from biomass burning is contributed from CRB prevalent in Punjab and Haryana in winter..
. Selected excerpts from older 2016 report by IITK for NCR
Ambient air pollution control has seen several horizons. Primary regulatory policy is polluters pay and specifications are developed to reduce emissions from cars and other sources. Enforcing these may be problematic as the Volkswagen "diesel dupe" shows. Long term 10-15-year plans are required over large geographical area covering multiple sources and economic and pollution clusters. This is a case for NCR and includes sun setting power plants, reduction in diesel cars and more strict control on procedures for construction and road dust cleaning and scrubbing.
However, Indian cities grow very rapidly and have proven to be immune to top down planning or management. The city suffers not from a particular source alone but by aggregation across all sourcesSpurt in diesel genset or brick kilns at the outskirts can happen very fast. This is a case for more shorter 3-5 year adaptive plans based on granular data
Cities may adopt graded action plan (GRAP) in short term emergency. The GRAP for Delhi suggests actions when air quality deteriorates:
- Stop garbage burning and impose fine;
- enforce regulations on brick kilns;
- enforce pollution control on power plants;
- periodic mechanised sweeping on roads with heavy traffic and water sprinkling on unpaved roads;
- vigilance for visible emissions and enforcing pollution under control (PUC) norms;
- dust control in construction activities;
- deploy traffic police for smooth traffic flow;
- enforce Supreme Court order to allow entry of trucks registered only after 2005.
The primary difficulty with regulatory approaches are that they are focused on control of pollutants and are effective only on strict punitive implementation at mass scale. The success of Beijing during and post the Olympics is a case study.
Before the Games began, all coal plants were required to install devices to decrease emissions.300,000 High-emitting vehicles were replaced by increased public transportation options, some 100 chemical plants in Beijing were shut down, and the government increased the price of gasoline to discourage the use of cars. During the Games, additional restrictions were put in place. Vehicles with odd numbered plates could only circulate on odd days, while even numbered plates were only allowed to circulate on even days. All cement, concrete, and lime plants were closed, and power and chemical plants were required to decrease emissions by 30 percent. This was expanded to neighbouring Tianjin, a city with the same population as New York.
China was estimated to have invested $17.3bn to improve air quality in the capital.
These measures caused a sudden and sharp decrease in air pollution levels in Beijing and nearby cities. For instance, the particulate matter in the air (PM10) in Beijing decreased by an average of 18 percent during 2008 and 30 percent during the Games. After the Games, the air quality worsened again, suggesting that the measures were successful while enforced.
See the University of Southern California (USC) China section notes for the Olympics.
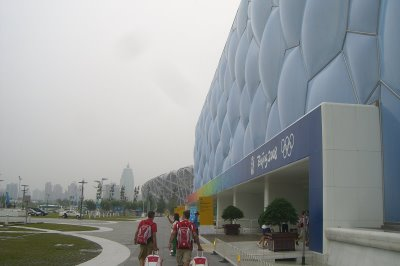
July 31, 2008 |
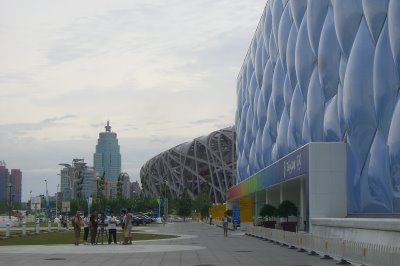
August 1, 2008 |
China has enhanced the Law on Prevention and Control of Atmospheric Pollution
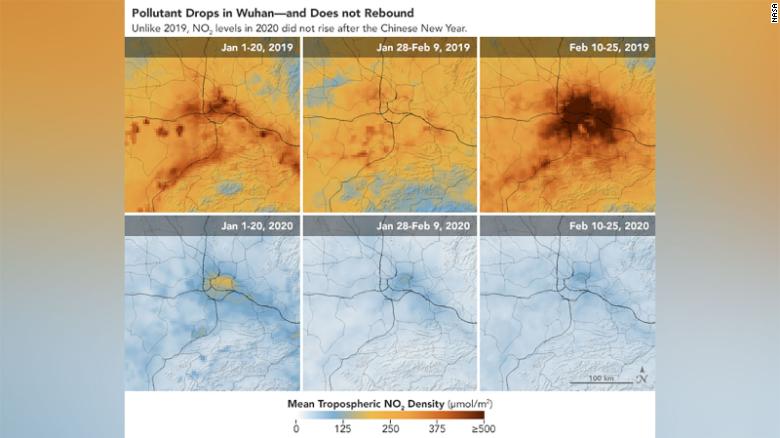
In 2020 the Wuhan Covid-19 lead to a large scale reduction in NO2 pollution as evidenced by these images from NASA
Mitigation
- Money Plant (Epipremnum aureum) formaldehyde and carbon monoxide (CO)
- Areca palm (Dypsis lutescens) absorbes carbon dioxide and releases oxygen.
- Mother-In-Law's Tongue or snake plant (Sansevieria trifasciata) toxins such as nitrogen oxide, xylene, carbon monoxide, benzene, and formaldehyde from the air. They produce oxygen at night, even in a dark room.
Individuals and smaller communities may want to look at methods to reduce health effects by reducing pollution around their activity. Some startups offer nano-filters for embedding in the nose. N95 and N99 masks are also an option. Personal home or car air purifiers based on High-efficiency particulate arrestance (HEPA) filters are seeing a uptick in sales. These need power, suck air and filters need to be cleaned or replaced. Natural plant is an option but we do not have conclusive data on density of plants needed or actual reduction. Studies show large variation. 9-11% reduction of PM2.5 near woodlands and removal of approximately 300 metric tons of air pollutants from Christchurch, New Zealand and 1,261 metric tons of pollutants, in Beijing have been reported.
What can a Hospital, a School or a Mall do to improve AQ?
Rain and trees are well accepted methods to reduce pollution in the air. Tress and hedges may reduce PMI 2.5 by 10% or more. Biotechnology can be used to make urban forests much more effective. A small barren patch of land can be converted to a Urban Forest within 3 years. Afforestt, eco-entrepreneur Shubhendu Sharma is creating mini-forest ecosystems using an accelerated method. It’s based on the practices of Japanese forester Akira Miyawaki, as well as on Sharma’s own experiences gleaned from his former career in car manufacturing. Watch his TED talk at https://goo.gl/2lIJYK . There are few NGOs like SayTrees which are doing tree plantation using Miyawaki way.
CityTree from GreenCitySolutions is a biotechnology accelerated freestanding enclosure intended to be placed at locations with dense people movement. Other researchers are able to increase effectiveness of photo synthesis by 10X.
Scrubbing clean air in public places is energy expensive. Malls are trying. Scrubbers can be fitted in vertical wind turbines.
 Neighbourhood or Cities actions
China has more then a dozen cities trying large towers. These go from 10 to 100 meters . The largest one in Xian in Shaanxi province sucks in polluted air and funnels it into football size greenhouses at the base of the structure, which heat the air before it is filtered and vented. Although still under testing by researchers at the Institute of Earth Environment at the Chinese Academy of Sciences, it is claimed to reduce smog levels in the city, and hopefully reduce PMI2.5 by 18%

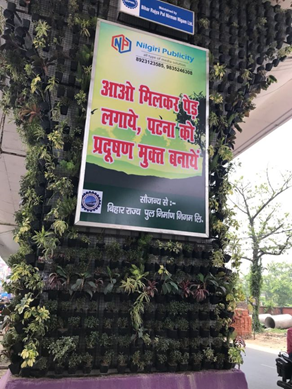
There are other methods. Photo synthetica urban algae uses 16 by 7 meters bioreactors. 3M has smog reducing granules that may be used over roofs and Devic Earth has a unusual approach of weak pulsed radio waves that encourage small particles under 20 microns to undergo dry deposition( crystallization in Aerosol? ) . This shows results in experiments over large areas in several Sq Kms. The Dutch designer Daan Roosegaarde installed a small 10 meter Smog Free Tower in Beijing in 2016 and has suggested a smog free bicycle which can clean while pedalled. Vertical gardens or urban forests movements are also gaining some momentum like in Patna and Bangalore especially on road pillars . Milan Bosco Verticale may be underway in Urban India!!

Indian cities grow very rapidly and have proven to be immune to top down planning or management. The city suffers not from a particular source alone but by aggregation across all sources. It is difficult to know 5 years in advance what will be the concentration of emitters. Spurt in diesel genset or brick kilns at the outskirts can happen very fast. This is a case for more shorter 3 to 5 year adaptive plans based on granular data. We need to measure at many locations and do cost benefit analysis for different coercive solutions or incentives for pollution reduction methods by cities, communities, neighbourhood.
Project Usiru is based on 6-12 interventions in smaller locality. These will be based on some CSR funding or Government seed funding, community ownership, active NGO engagement and one or a combination of changes . Usiru will lay out in advance a large data sensor cloud and establish the difference from a baseline before intervention and after. The experiments will be active and may make changes based on partial progress and data. Interventions will be scored for reach ( Household, locality, Ward or city ), depth ( 15% or lesser, 30% to 50%, over 50% changes ) and friction ( ease or effort from residents) . We expect some success to be base of larger enduring adoption wither thru coercive measures or incentives and nudges.
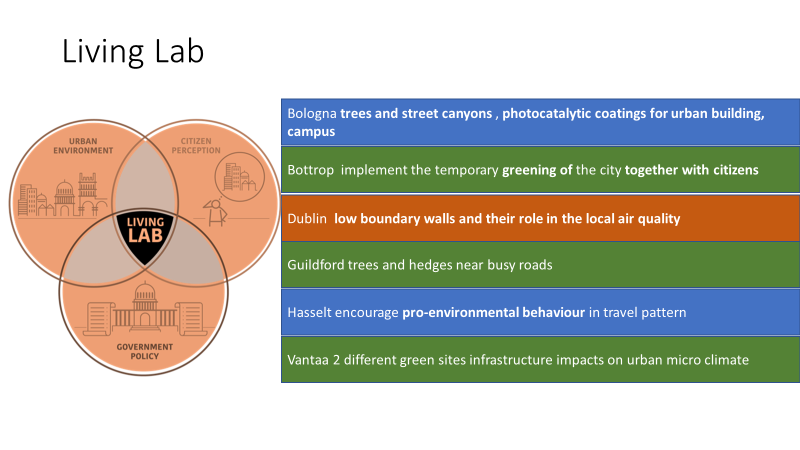
We found iScape Living labs as another organization with similar plans of exploration, experimentation and evaluation. They have 6 experiments underway in 1Q 2019.
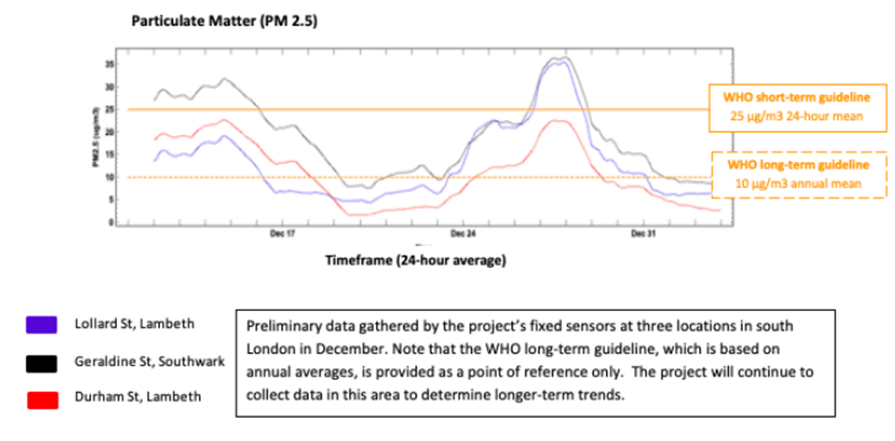
A part of reaching firm conclusions ( Like odd-even scheme in Delhi ) is the inherent large scale variability in measures of ambient air pollution. PMI2.5 is most variable with up-to 100% in a day and 800% across seasons. Breathe London created a network of 100 state-of-the-art sensors and began driving two specially equipped Google Street View cars through the capital to measure air pollution. The graphic shows Breathe London fixed monitors near 3 schools. This shows 55 to 75% variation within 24 hours on a summer day!
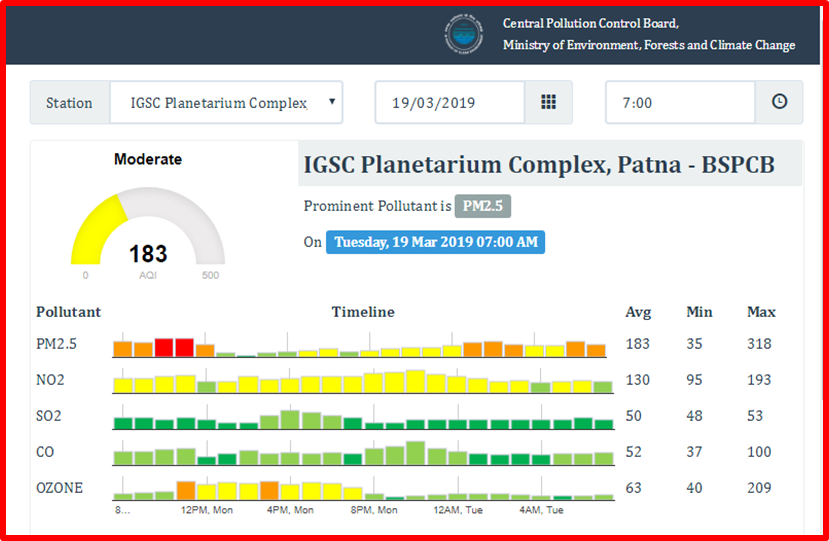
Patna reported the following for a moderate AQI day 19 March 2019. PMI2.5 AQI (the linear index based on concentration) varied from an average of 183 to a low of 35 (-81%) and a high of 318 (+74%). The situation on a very poor AQI day of 13 Nov 2018 was an average PMI2.5 of 371 over 100% higher mean then the moderate March day.
EDF ( Environmental Defence Fund ) talks about ‘‘Why new sensor tech is critical for tackling air pollution around the globe”. They used new mobile sensors for block by block insight.
Our pioneering work with Google in Oakland and Houston shows that levels of air pollution vary much more widely than was previously known.
We now know that levels of air pollution can vary by up to eight times within one city block – and that living in areas with the most elevated levels increases heart attack risk in the elderly by 40 percent, similar to a history of smoking.
IoT Sensor Cloud
The large variability in pollution measures within a day and across seasons as well as locations not too far away poses significant requirements on reaching firm conclusions on cost benefit of any intervention. We need to measure PMI around 4 locations per Sq Km at hourly intervals over 2 years ( Sumer, monsoon and winter) to establish a data base to make statistically valid conclusions . A 30% or higher reduction in PMI index may need at least 90-120 data points to include the large variation in the concentrations.
Since mobile sensors may not be very high quality ( see next section on sensors) and may have correlations of 0.8 with regulatory instruments, we plan the following for Bangalore 700 SqKm urban area in Project Usiru.
- 6-20 high cost fixed location PMI + VOC (Volatile Organic gases) . Regulatory grade Gold class
- 30-100 medium cost fixed location PMI + VOC Commercial grade Silver class at community groups and corporates
- 1,500-2,000 low cost fixed location PMI + VOC Commodity grade Bronze class with residents.
- 300-800 low cost mobile location PMI + VOC Bronze grade with residents/ companies in car, trucks.
- 10-25 weather stations for wind, precipitation, sunshine, temperature. Mixture from community, companies and government.
- 20-50 vibration and noise sensors to detect usage of Diesel gensets
- 8-15 location based hourly photographs of view from road junctions, airport, metro and bus stations etc
- Data on water precipitation, rainfall using 80 stations of KSNDMC ( Karnataka State National Disaster Management Centre )
- Use the new C-40 Air Pollution Control Command Room being commissioned by BBMP
- Special custom vans with high quality sensors for calibration of Bronze grade sensors in use
One of the criticisms of our crowd sourced approach has been on commodity low cost sensors. In the section on sensors following this, we have documented how regulatory bodies world-wide are trying to broaden and use commodity sensors on a larger base.
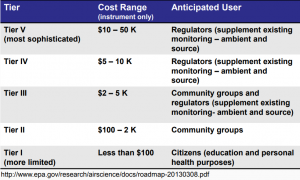
Historically regulators and government bodies have used high grade and expensive sensors and equipment. The US EPA classified them by tiers in a 2014 roadmap report.
 This reduces the number of locations where we can sample data and there has been a great need to have many more locations. In recent years, consumer-level air quality monitors embedded with low-cost optical particle sensors have come onto the market, costing less than $300 each. Similar to some expensive monitors used for research, they operate by sensing how light bounces off particles in the air -the light scatters differently depending on the size of the particle it hits. The light-scattering method is well established, but its effectiveness can vary widely, depending not only on the components used within a given monitor but on the type of pollution.
The need to use a mixture of low-cost sensors and medium and high grade has been advocated by the US EPA too. A study by Lawrence Berkeley National Laboratory supported by DOE's Building America Program and the Environmental Protection Agency offers help
Current sophisticated, expensive ambient air pollution monitoring technology is not economically sustainable as the sole approach and cannot keep up with current needs, specifically new monitoring networks and special purpose monitoring.
They used 7 consumer monitors cost between $199 and $280. They also tested research monitors that cost thousands of dollars. The readings were compared with two high-end reference systems. (Thermo pDR‐1500, MetOne BT‐645), a Grimm Mini Wide‐Range Aerosol Spectrometer (GRM), and a Tapered Element Oscillating Microbalance with Filter Dynamic Measurement System (FDMS), a Federal Equivalent Method for PM2.5. Sources included recreational combustion (candles, cigarettes, incense), cooking activities, an unfiltered ultrasonic humidifier, and dust. FDMS measurements, filter samples, and known densities were used to adjust the GRM to obtain time‐resolved mass concentrations.
Four of the consumer monitors were able to reliably detect (Spearman’s correlation >=0.8) an increase in pollution from particles with a diameter 2.5 micrometers or smaller, the inhalable fine particles known as PM2.5. ( But failed for smaller then 0.3 micrometres)
The study authors noted, however, that because most sources of indoor air pollution contain both larger and smaller particles, the monitors could still help reduce exposure to ultrafine particles by generally detecting when air quality worsens and triggering better ventilation during those times.
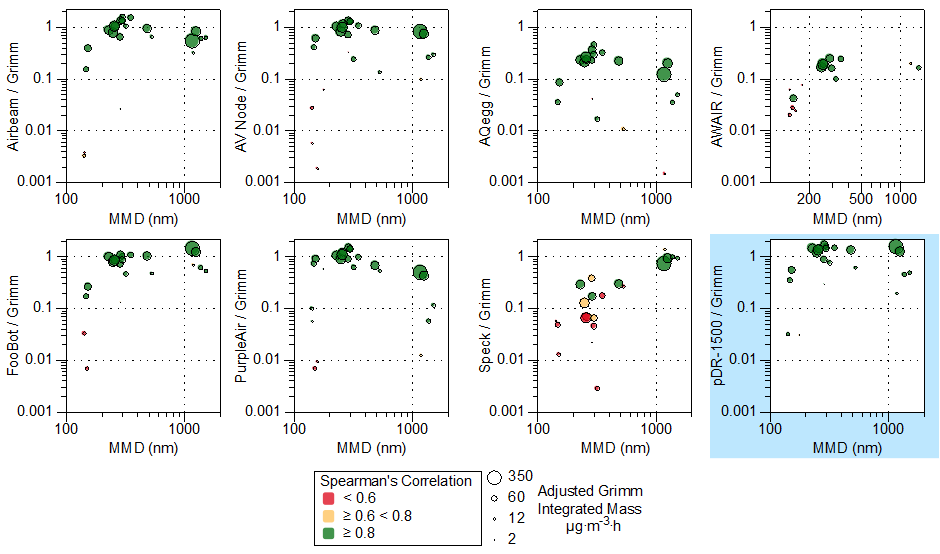
Ratios of time-integrated mass concentrations measured by consumer grade monitors to the estimated true mass concentration determined with the Grimm Mini-WRAS adjusted with the estimated density of each source. Each plot provides results for all sources, with individual data points sized according to the source magnitude in mg m-3h.
Startup Oizom has also published a month long trail in 2016 to correlate their Polludrone Pro with GPCB (Gujarat Pollution Control Board) Pollution Monitoring Station at Kankaria-Maninagar (Ahmedabad) . While there are differences in absolute measurement the correlation to the changes in parameters are reasonably high (0.8+).
SATVAM: An IoT Network for Air Quality Monitoring is a project underway at IIT Kanpur, IISc, IIT Bombay funded by Department of Science and Technology (DST) and Intel, and administered by the Indo-US Science and Technology Forum (IUSSTF). The project is exploring IoT based approaches and experimenting with local distial signal processing to improve caliberation and correlation between commodity sensors and regulatory sensors. We expect correlation above 0.8 would be achievable and sufficing for Project Usiru
Crowd sourced Data : Democratizing Data
We will cover more details of open data platform and methodology in future as our project evolves. We aim to ensure data from government, organizations, community and individuals get published in an open data platform.
- We expect some vendors to provide sensors which will directly feed to the Usiru platform
- We expect to work with government bodies like KSNDMC and the new C-40 command centre to source their data
- We will encourage residents to work with the Air Quality platforms and devices to re publish them in Usiru
- Usiru will benefit from active open data communities who will help facilitate tools and process to source data from heterogenous places
Data science methods can easily provide high degree confidence on the centre of gravity ( daily, weekly or monthly average ) of pollution and shift . We are more concerned at relative difference between measure before and after an experiment. We will consult with institutions like Centre for Environmental Science & Engineering, IITK, IISC and companies like Bosch on
- Initial verification of correlation and sensitivity of common devices . A low cost, quick field level process to estimate a figure-of-merit of the device. Gold or regulatory level, Silver or industrial/ commercial level and Bronze for commodity, common usage
- Ongoing checks using reference devices in mobile vans
- Data Science methods to detect anomaly
- Ways for consumers of the data to segment by figure-of-merit of the devices.
We expect to have help from the IT Community to develop a API for vendors to integrate Usiru data in the Air Quality maps shown to user and for service providers to benchmark their services with the community at large.
During the project we will showcase the experiments planned, underway and results. We will also show the individual and small neighbourhood area measurements for all the data the platform is receiving. We expect the open data and activist and NGO to collaborate to provide following
- Information of measurements for a location or neighbourhood
- Trends for a location or neighbourhood
- Measures of location information. Buildings, Foliage, roads, population, construction activity
- Insights on cause and effects
- Suggestions for better measurements and changes in experiments
Community Participation
We are launching a collaboration website at http://tinyurl.com/UsiruBLR
We invite Pollution experts, activists, device providers, NGO, Open Data community who want to work on this project to get involved. We also encourage organizations willing to explore funding some experiments and CSR effort to reach out to us.
We aim to finish detailed project work and operationalisation plans agreed with with Bangalore Smart City Ltd (BSCL) and expect to have Clear Air Platform, Smart City Namma Bengaluru , Centre for Environmental Science & Engineering, IITK and others as partners and set up a governance structure in 6 months by end October .
Watch this space….



[…] out the form provided at the beta Usiru website. https://bit.ly/UsiruBLR .The long blog at http://www.iotforindia.org/usiru covers the project in […]